U.S. Fiscal Health Is Failing
December 3, 2019
This is a supplemental article to the September/October 2019 Disclosures cover feature, "What's America Really Worth?" Both articles by VSCPA members sound the alarm about the financial situation of the United States.
By Gary Dittmer, CPA, CMA, CGMA
The U.S. House and Senate passed legislation prior to their August recess, which was signed by President Donald Trump, that suspends the debt limit and sets spending levels for the next two years. The debt limitation was established by the Second Liberty Bond Act of 1917, which became law as World War I was on the horizon. This established an aggregate debt limit and limitations on specific bond issuances.1 Over the years the debt limitation was expanded to include all federal debt and not specific debt issuances.
The debt limit was intended to enforce discipline on Congressional spending. But the reality is quite the opposite. Federal spending historically exceeds revenue by significant amounts, resulting in political theatre to raise the debt limit after the fact. Sometimes this drama triggers a government shutdown, causing distress for government workers and financial markets.
On July 26, 2019, U.S. Comptroller General Gene L. Dodaro testified before the Senate Budget Committee on the federal government’s unsustainable fiscal plan. According to his report, the public held share of the federal debt amounted to 78 percent of Gross Domestic Product (GDP) on Dec. 31, 2018, while the average since 1946 has been 46 percent of GDP. As a reminder, fiscal policy (taxation and spending) is controlled by Congress and approved by the President. Monetary policy, controlled by the Federal Reserve, refers to the control of the money supply and interest rates. GDP is the value of all goods and services produced during an annual period.
The problem is the long-term imbalance between government receipts (taxes and fees) and outlays (spending). This disparity can be seen in the following table of receipts, outlays and the resulting annual deficit.2
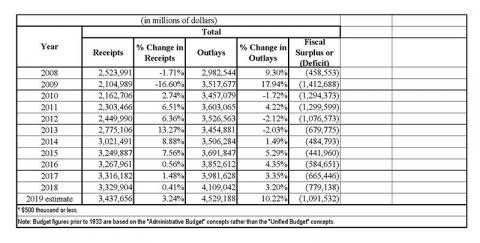
The 2019 projection indicates a 10.22 percent increase in spending, while revenue is projected to increase by 3.2 percent resulting in an addition to the federal debt by almost $1.1 trillion. This magnitude is staggering and raises the question: What is $ 1 trillion dollars? Think of 1,000 stacks of $1 billion and a reminder that $1 billion is 1,000 stacks of $1 million.
Some suggest that federal deficits don’t matter. This is known as modern monetarist theory (MMT). Several presidential candidates, congressmen and Warren Buffet (in his 2018 letter to shareholders)3 subscribe to this theory. Both political parties apparently agree, as demonstrated by their administrations’ history of excessive spending. Investors, bankers and MMT aficionados look to the market, unemployment and consumer/business confidence to solidify their view that deficits don’t matter. Well, if you review the data, the federal government hasn’t had a surplus since 1999 and 2000, and combined those were only $88 billion. You have to search back to 1960 for another one-year surplus. Therefore, is it possible the MMT is correct? If successful leaders like Buffett and leading politicians argue that deficits don’t matter, and if the United States has been running deficits for most of its post-WII existence, what is the problem?
Remember: There is a limited amount of capital available for government and private financing. If federal government borrowing absorbs 50 percent of available capital, then there is 50 percent available for private debt to be used for job creation, investments, etc. How the government debt is financed matters, for example, if it’s financed by printing money because inflation will result (a form of taxation on capital). If it’s financed by taxes, there will be less capital available for investments, job growth, savings or consumption.
The national debt reflects the cumulative effect of annual fiscal deficits. The total debt (both public and intragovernmental) as of 2018 was $21.5 trillion (which equals 2018 GDP) with the public holding $15.7 trillion and the remainder held by various government agencies (the largest debt holding agency is Social Security Trust Funds). The amount of interest paid on the 2018 debt was $325 billion — that number is approximately 8 percent of government spending. Interest will only grow as deficits are planned for the foreseeable future and will become a larger part of the federal budget.
A World Bank study of developing and developed nations found that when the ratio of government debt to GDP is 77 percent or higher, economic growth suffers.i Does this mean the U.S. is in danger? Not yet; we are the largest economy with stable financial markets, the rule of law and a stable currency. However, at what cost will investors continue to invest in our bonds? Milton Friedman argues the only benefit of rising federal interest cost is that Congress cannot spend this amount on other forms of government spending.4 Paying interest to bond holders does not absorb labor or capital and it is more in the nature of a transfer.
Some suggest the Federal Reserve is keeping interest rates artificially low, resulting in non-productive borrowing in which funds are not used for productive property or job creation, but rather to pay dividends and buy back corporate stock. (See Apple’s 2017 Form 10-K note 6 as an example of a public company borrowing to buy back its stock and pay dividends.) Easing interest rates and rapid growth of the money supply (from $1.8 trillion in July 1982 to $14.5 trillion in April 2019) stems from the 2009 financial crisis when the Federal Reserve purchased mortgage debt and related securities to prevent a worsening recession. The Fed is now attempting to shrink its balance sheet and the money supply. Normally an increase in the money supply could lead to inflation, but this has not happened as cheap foreign labor produces many of our goods. The report by the Inspector General cited earlier should sound an alarm to policy makers, citizens and the business community that closer scrutiny over federal spending is long overdue.
Social Security and the aging population are often mentioned as a cause of budget deficits. The usual sound bites that entitlements are causing deficits are more hyperbole than fact. Since its inception in 1935, Social Security has produced cumulative surpluses, which are known as the trust funds (the Old Age and Survivors Trust Fund and the Disability Insurance Trust Fund). The trust funds are invested in federal bonds, making Social Security the largest holder of intragovernmental debt.
Evaluation of Social Security and Medicare should be on a net basis because payroll taxes have historically funded the program. The combined trust fund balances at Jan. 1, 2019, were $2.9 trillion. According to projections, if no changes are made to the system, this will start reversing and cause Social Security trust funds to be depleted by 2034 and Disability Insurance Trust Fund to run dry by 2052.
The Federal Insurance Contributions Act (FICA) imposes a tax on both employers and employees. There are two components to this tax:
The Old-Age, Survivors and Disability Insurance or Social Security tax is 12.4 percent, which is shared by employers and employees.
The Disability Insurance or Medicare tax is 2.9 percent and also shared by employers and employees.
There is an additional Medicare tax of 2.9 percent on taxpayers’ wages, exceeding $250,000 for a joint return, $125,000 for a married individual filing separately and $200,000 for others.
There are numerous exceptions to the definition of wages for FICA tax purposes, such as retirement and pension plans, accident and health benefits, cafeteria plans and certain fringe benefits.
The House Committee on Ways and Means held a hearing on the Social Security system (Social Security 2100) on July 25, 2019, and is proposing changes to the taxation of benefits and other provisions to further strengthen the system. In preparation for this meeting, the Joint Committee on Taxation prepared an analysis of the Social Security system and its revenue sources, which is available on the Committee’s website.5
Can we be optimistic about the future of Congressional fiscal restraint? History tells us otherwise; it will take a crisis for Congress and citizens to wake up and reform governmental spending.
In the meantime, Congress will continue to rely on investors’ willingness to buy our debt to finance excessive governmental spending, and interest payments will become an increasing portion of our federal budget. With a little foresight we can prevent a financial crisis, but time is of the essence. In the event of a recession, what tools are available to the government to alleviate a recession’s impact?
Traditionally, the first choice was deficit spending (financing), but there is not much wiggle room when our deficits are consistently near or at $1 trillion. How about increasing the money supply or reducing interest rates? The Federal Reserve has interest rates historically low and the money supply is historically high. Therefore, the normal tools used to alleviate a recession are not as feasible as in the past. The time for action is now.
Gary Dittmer, CPA, CMA, CGMA, retired as senior tax director for Spok, Inc., in Springfield. He is an adjunct professor at George Mason University and the University of Virginia School of Continuing and Professional Studies, where he teaches taxation. Contact him at gdittmer at comcast.net.